Computer graphics is the reason to review it. Hopefully this will be a gentle reminder, and something that can be applied right away. There shouldn't be anything scary here, and it should be a reminder, and not something that requires hours of complex math to have it make any sense. This will apply to computer graphics, and will show shortcuts in ways that make sense.
I will assume that there is some facility that can be used to draw the computer graphics with. Even using a spreadsheet, some of these concepts can be figured and displayed. Most spreadsheets will allow Sine and Cosine calculations and a table of Y and X values to be plotted. Using that concept, most of these ideas can be visualized.
Starting with those two functions that didn't seem to have any relation to anything, Sine and Cosine. The Sine button returns some number when entered in a calculator. That number is kind of a percentage of the way around the circumference of a circle, or at least a quarter of one, since it goes negative about half way, and the numbers repeat on the odd quarters. Cosine is similar to the Sine, but it repeats in the middle two quarters, and starts at 1 instead of 0.

Angles can be measured in degrees or radians. Most people are comfortable using degrees, since they tend to be whole numbers, starting with 0 and going to 360. Computers work better in radians, which is values between 0 and 2*pi, but they also come with conversion capabilities. In Java, the Math class library contains toDegrees and toRadians static methods. Pass a degree value to the toRadians function, and the computer will return the equivalent angle in radians.
An Application
Most instrument panels in modern aircraft are computer screens. The Engine Instrument Systm (EIS) display in the aircraft will draw the values of the engine in round gauge representations, like the old analog instruments. Applying the Sine and Cosine thoughts above, the values can be easily displayed in a nice analog looking gauge.

The first thing to consider when drawing the gauge is how big around the gauge will be. The one unit circle will allow scaling by multiplying by the desired radius. A simple gauge might be 100 pixels in diameter, and on a 100 pixel per inch screen, that will be about about a 1 inch circle display.
Most gauges don't go all the way around. Many only go 270 degrees, and some only go 90 or 180 degrees. Choosing how far around the gauge goes will be key to plotting accurate instruments. The instrument may not be oriented at 90 or 180 degrees, some displays will show gauges starting at 45 degrees.
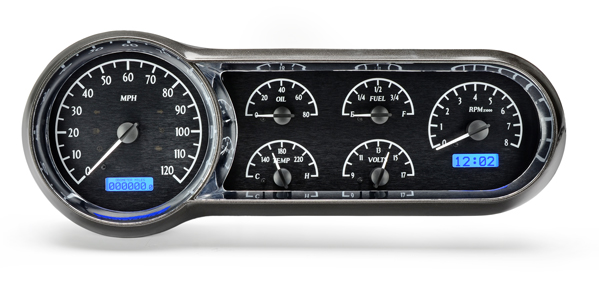
The tachometer and speedometer gauges in the above cluster are 270 degree gauges, starting at 45 degrees (or really 235 degrees). The other smaller instruments only go 180 degrees. Thinking of the line as the pointer on the gauge, the place where the end will be drawn will be a fraction of that number of degrees.
For the time being, ignore the direction of rotation. The animation at the top of the page shows counter clockwise rotation, and that is normal for trigonometry. There is a shortcut to reverse that if desired, and that will be covered later.
To build a speedometer as shown above, with a 270 degree display that goes from 0 MPH to 120 MPH the math is simple ratios. Use the speed to be represented, 60 MPH and divide that by the maximum speed, 120 MPH to get the fraction of the circle that the needle will need to cover. 60/120 = 0.5. Multiply this result by the maximum angle that the speedometer will display, 270 degrees * 0.5 = 135 degrees. So to draw the needle on the speedometer, calculate the Cosine and Sine of 135 degrees to get the X and Y values of the
unit circle, then multiply those values by the radius of the display, and draw a line from the center to the specific position.
Translation
Sine and Cosine maybe is starting to make sense. Then the computer part starts to complicate things. The Sine of 135 degrees is -0.7071, but the screen only goes from 0 to 1000 or so. If a negative value is plotted, it will be plotted off the screen somewhere. Some computers handle that gracefully, while others won't. Either way, the results are not what the users expected. The drawing must be translated to the proper position.
Most drawing planes start with 0,0 in the upper left, where the trig unit circle tends to have the 0,0 position in the center. The actual drawing center needs to be moved down and to the right. To move the circle from the unit scale to the drawing canvas, the coordinates must be added. The origin X and Y position should be changed by the radius of the desired circle. As the picture above shows, the center was moved from (0,0) to (50,50).
The end point must be scaled and translated. To make the end be on the 50 pixel circle, the the -0.7071 should be multiplied by 50 giving about -35 pixels, and the 0.7071 also multiplied by 50 giving about 35 pixels. The (-35, 35) needs to be moved down and to the right. To the right is mostly straightforward, by adding 50 to the -35 the results will be the expected 15 X position. The Y position requires an inversion, because the positive values on the unit graph go up, where the positive values in the drawing canvas go down. The new Y position is mirrored and adjusted 100-Y+50 or 100-85=15. The center has the same Y inversion, but 100 - 0+50 is still 50.
To draw a pointer at 255 degrees, the point on the unit circle will be (-0.2588,-0.9659). To translate that to a 50 pixel radius drawn canvas, again the center will move to 50, 50. The X position will be 50 * -0.2588 = =13, and 50 * -0.9659 = -48. (-13, -48) translated will move it to (50-13=37, 100-(-48+50)=98).
Maybe translation is harder than the trigonometry?
The speedometer gauge that is shown in the picture above has the 0 speed at 235 degrees, and the needle rotates clockwise. To make that work properly, there will need to be some additional translation. A shortcut to reversing the rotation is to mirror the gauge. Since the gauge is centered about the Y axis, it is easy to mirror the values, by subtracting x value from the width.
Rotation
The speedometer above still doesn't start at the horizontal origin. The 0 MPH value is about 45 degrees below the horizontal. Sines and cosines are cyclic functions. Cyclic means that if the rotation continues past 360 degrees, the sine and cosine of next 360 degrees will be the same as the first 360 degrees. The sine and cosine of a negative rotation will be the same as 360 + negative angle. The sine of -15 degrees is the same as 345 degrees (360 - 15 = 345).
Moving the 0 speed down 45 degrees is just a matter subtracting 45 from the angle calculated for the speed.

The rotation will still use the same ratio of Speed/maxSpeed * sweepAngle, but after that calculation simply subtract the desired rotation. In the above display, the 135 degrees will be changed to 90 degrees (135 - 45 = 90). The sine and cosine will be calculated after the rotation. Don't worry about values less than 45 degree, the cyclic nature of the sine and cosine functions will return the proper values.
More Applications
The above work is good for pointers in a circle display, and can be used for drawing tick marks and placing the numbers in a gauge. For calculating tick marks, consider a line with two radii. There is an inner radius (r1) and an outer radius. The same calculations will be used, but the start of the line will be at the r1 point, and the end will be at r2.

Angle = (Speed / maxSpeed * sweepAngle) - rotation
Angle = (80 / 120 * 270) - 45
135 = 180 - 45
So this will put the pointer to the left of vertical, but in the X calculation it will be mirrored across the Y axis, and end up in the proper right of the Y axis position. The X and Y are calculated using the Angle found in the previous calculation as explained above:
X = Width - (cosine(Angle) * radius + Width/2)
X = 100 - (cosine(135) * 35 + 100/2)
X = 100 - (-0.7071 * 35 + 50)
75 = 100 - (-25 + 50)
Y = Width - (sine(Angle) * radius + Width/2)
Y = 100 - (sine(135) * 35 + 100/2)
Y = 100 - (0.7071 * 35 + 50)
25 = 100 - 75
The X and Y calculations above are for r1, r2 sould be calculated using the same angle, and change the radius. The tick marks are drawn as a line between r1 and r2 on the canvas. The placement of the numbers near the tick marks can be done as above using another radius.
The above calculations are rounded to integers. Some drawing canvases will take floating point numbers. If the drawing canvas will take floating point numbers, it is best to leave the values in the calculations in the floating point format, so they may be as accurate as long as possible.
To build the other smaller gauges above, the above calculations apply, but the sweep angle changes to 180 degrees, and the max value changes to something appropriate.
To see the application of this work, follow my other Blog.
Schweet! Now can I get a blue tooth adapter on the Grand Rapids EIS 4000's serial port & use this software?
ReplyDelete